By following this how-to and integrating HCL DX metrics into Google Cloud Managed Service for Prometheus (GMP), you achieve superior operational efficiency and deep application-level observability:
-
Eliminate Overhead: GMP is a fully managed service that automatically handles the scaling, sharding, and maintenance of the metrics collectors, freeing your operations team from managing Prometheus infrastructure like storage and high availability.
-
Gain Deep Insights and Proactive Alerts: Integrating HCL DX metrics into your company-wide observability stack allows you to move beyond basic health checks. You can set up actionable alerts based on critical indicators of system stress, such as WebContainer thread pool saturation, database connection starvation, or other interesting application performance metrics, preventing severe latency or cascading failures.
Context
Google offers a comprehensive suite of managed services within Google Cloud. For example, GKE Autopilot completely self-manages the Kubernetes cluster nodes, removing the need for manual node maintenance, OS patching, and capacity planning.
Alongside compute management, Google provides a fully managed monitoring portfolio, including Google Cloud Managed Service for Prometheus (GMP). GMP is designed to be a drop-in replacement for self-hosted Prometheus. It allows you to seamlessly collect metrics from your existing workloads while Google completely handles the underlying scaling, sharding, and maintenance of the metrics collectors. This means your operations team is freed from the traditional overhead of provisioning persistent volumes for metrics storage, configuring high availability, or managing complex Prometheus federation setups.
The Challenge
By default, HCL Digital Experience (DX) supports vanilla Prometheus installations. In a standard Kubernetes environment, HCL DX offers two primary methods for Prometheus integration:
-
Native pod
annotations(which the Prometheus server dynamically discovers). -
The creation of a Prometheus
ServiceMonitorCustom Resource for each deployment or statefulset (used heavily by the open-source Prometheus Operator).
However, neither of these methods works natively with GMP. Google Managed Prometheus operates using a proprietary collector that does not rely on standard ServiceMonitor resources or legacy annotations. Instead, it requires its own specific Custom Resource Definition (CRD) called PodMonitoring (for namespace-scoped scraping) or ClusterPodMonitoring (for cluster-wide scraping).
Because we generally want to restrict monitoring boundaries to the specific namespace where HCL DX resides, we will utilize the namespace-scoped PodMonitoring resource. By isolating our monitoring configuration to a specific namespace, we prevent unintended cross-namespace scraping, which is crucial for security, resource isolation, and maintaining clean multi-tenant environments.
Prerequisites: Pre-flight Checks
Before applying any configurations, you must ensure that Managed Service for Prometheus is actually active on your target cluster and that the required Custom Resource Definitions (CRDs) have been deployed to the Kubernetes API server.
-
Verify your kubectl context is pointing to the correct GKE cluster where DX is installed.
-
Check for the
PodMonitoringCRD:
kubectl api-resources | grep -i podmonitor
Note: If this command returns empty, or results in error: the server doesn’t have a resource type PodMonitoring, Managed Service for Prometheus is not enabled on your cluster. In practice, this usually indicates one of three things: the feature was never activated, your CLI is pointed at the wrong environment, or the CRD installation is pending. You must enable GMP via the Google Cloud Console or the gcloud CLI before proceeding.
HOWTO: Configuration Steps
When you installed DX in your cluster, you assigned your Helm release a specific name. You will use that release name to build a configuration YAML file (e.g., apply-mydx-podmonitoring.yaml).
In the example below, we are using mydx as the release name and mydx-ns as the target namespace. Search and replace these values with your actual release and namespace names.
Important Notice on Ports: The configuration below relies on standard DX named container ports (e.g., was-admin, composer). If you have heavily customized your Helm chart, you must verify your port names first by running:
kubectl -n mydx-ns get pods --show-labels
kubectl -n mydx-ns get pod <pod-name> -o yaml.
Tip: If you encounter scraping errors later, you can replace the named ports (like was-admin) with their direct numeric equivalents (like 10038) in the YAML. Using numeric ports can sometimes remove ambiguity during deep troubleshooting.
Create the following apply-mydx-podmonitoring.yaml file:
apiVersion: monitoring.googleapis.com/v1
kind: PodMonitoring
metadata:
  name: mydx-content-composer
  namespace: mydx-ns
spec:
  selector:
    matchLabels:
      app: mydx-content-composer
  endpoints:
    - port: composer
      path: /probe/metrics
      interval: 30s
---
apiVersion: monitoring.googleapis.com/v1
kind: PodMonitoring
metadata:
  name: mydx-core
  namespace: mydx-ns
spec:
  selector:
    matchLabels:
      app: mydx-core
  endpoints:
    - port: was-admin
      path: /metrics
      interval: 30s
---
apiVersion: monitoring.googleapis.com/v1
kind: PodMonitoring
metadata:
  name: mydx-dam-plugin-google-vision
  namespace: mydx-ns
spec:
  selector:
    matchLabels:
      app: mydx-dam-plugin-google-vision
  endpoints:
    - port: google-vision
      path: /probe/metrics
      interval: 30s
---
apiVersion: monitoring.googleapis.com/v1
kind: PodMonitoring
metadata:
  name: mydx-digital-asset-management
  namespace: mydx-ns
spec:
  selector:
    matchLabels:
      app: mydx-digital-asset-management
  endpoints:
    - port: dam
      path: /probe/metrics
      interval: 30s
---
apiVersion: monitoring.googleapis.com/v1
kind: PodMonitoring
metadata:
  name: mydx-haproxy
  namespace: mydx-ns
spec:
  selector:
    matchLabels:
      app: mydx-haproxy
  endpoints:
    - port: metrics
      path: /metrics
      interval: 30s
---
apiVersion: monitoring.googleapis.com/v1
kind: PodMonitoring
metadata:
  name: mydx-image-processor
  namespace: mydx-ns
spec:
  selector:
    matchLabels:
      app: mydx-image-processor
  endpoints:
    - port: image-processor
      path: /probe/metrics
      interval: 30s
---
apiVersion: monitoring.googleapis.com/v1
kind: PodMonitoring
metadata:
  name: mydx-persistence-node
  namespace: mydx-ns
spec:
  selector:
    matchLabels:
      app: mydx-persistence-node
  endpoints:
    - port: metrics
      path: /metrics
      interval: 30s
---
apiVersion: monitoring.googleapis.com/v1
kind: PodMonitoring
metadata:
  name: mydx-ring-api
  namespace: mydx-ns
spec:
  selector:
    matchLabels:
      app: mydx-ring-api
  endpoints:
    - port: ring-api
      path: /probe/metrics
      interval: 30s
---
apiVersion: monitoring.googleapis.com/v1
kind: PodMonitoring
metadata:
  name: mydx-search-middleware-query
  namespace: mydx-ns
spec:
  selector:
    matchLabels:
      app: mydx-search-middleware-query
  endpoints:
    - port: http
      path: /metrics
      interval: 30s
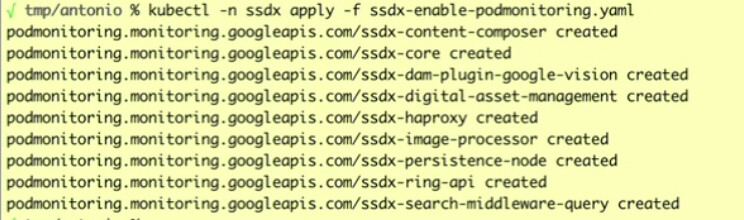
Apply this YAML file in the corresponding namespace. Remember that PodMonitoring relies on strict namespace scoping to function—it will unconditionally ignore pods located outside of mydx-ns:
kubectl apply -n mydx-ns -f apply-mydx-podmonitoring.yaml
You will get a response similar to this:
Testing & Verification
Once applied, it will take a moment for GMP to start ingesting data. Google Cloud’s global metrics backend (Monarch) requires a brief initialization period to register new time series data. During this window, the collector validates the endpoints, performs its initial HTTP scrapes, and flushes the payload upstream. So it’s a good time to go grab a coffee.
When you come back, you will be able to verify that Google’s operators have accepted the configuration, successfully reached the endpoints, and accurately populated the Metrics Explorer. Check first if you see the metrics, and see the troubleshooting section below if data is missing.
Metrics in Google Cloud Monitoring & Alerting
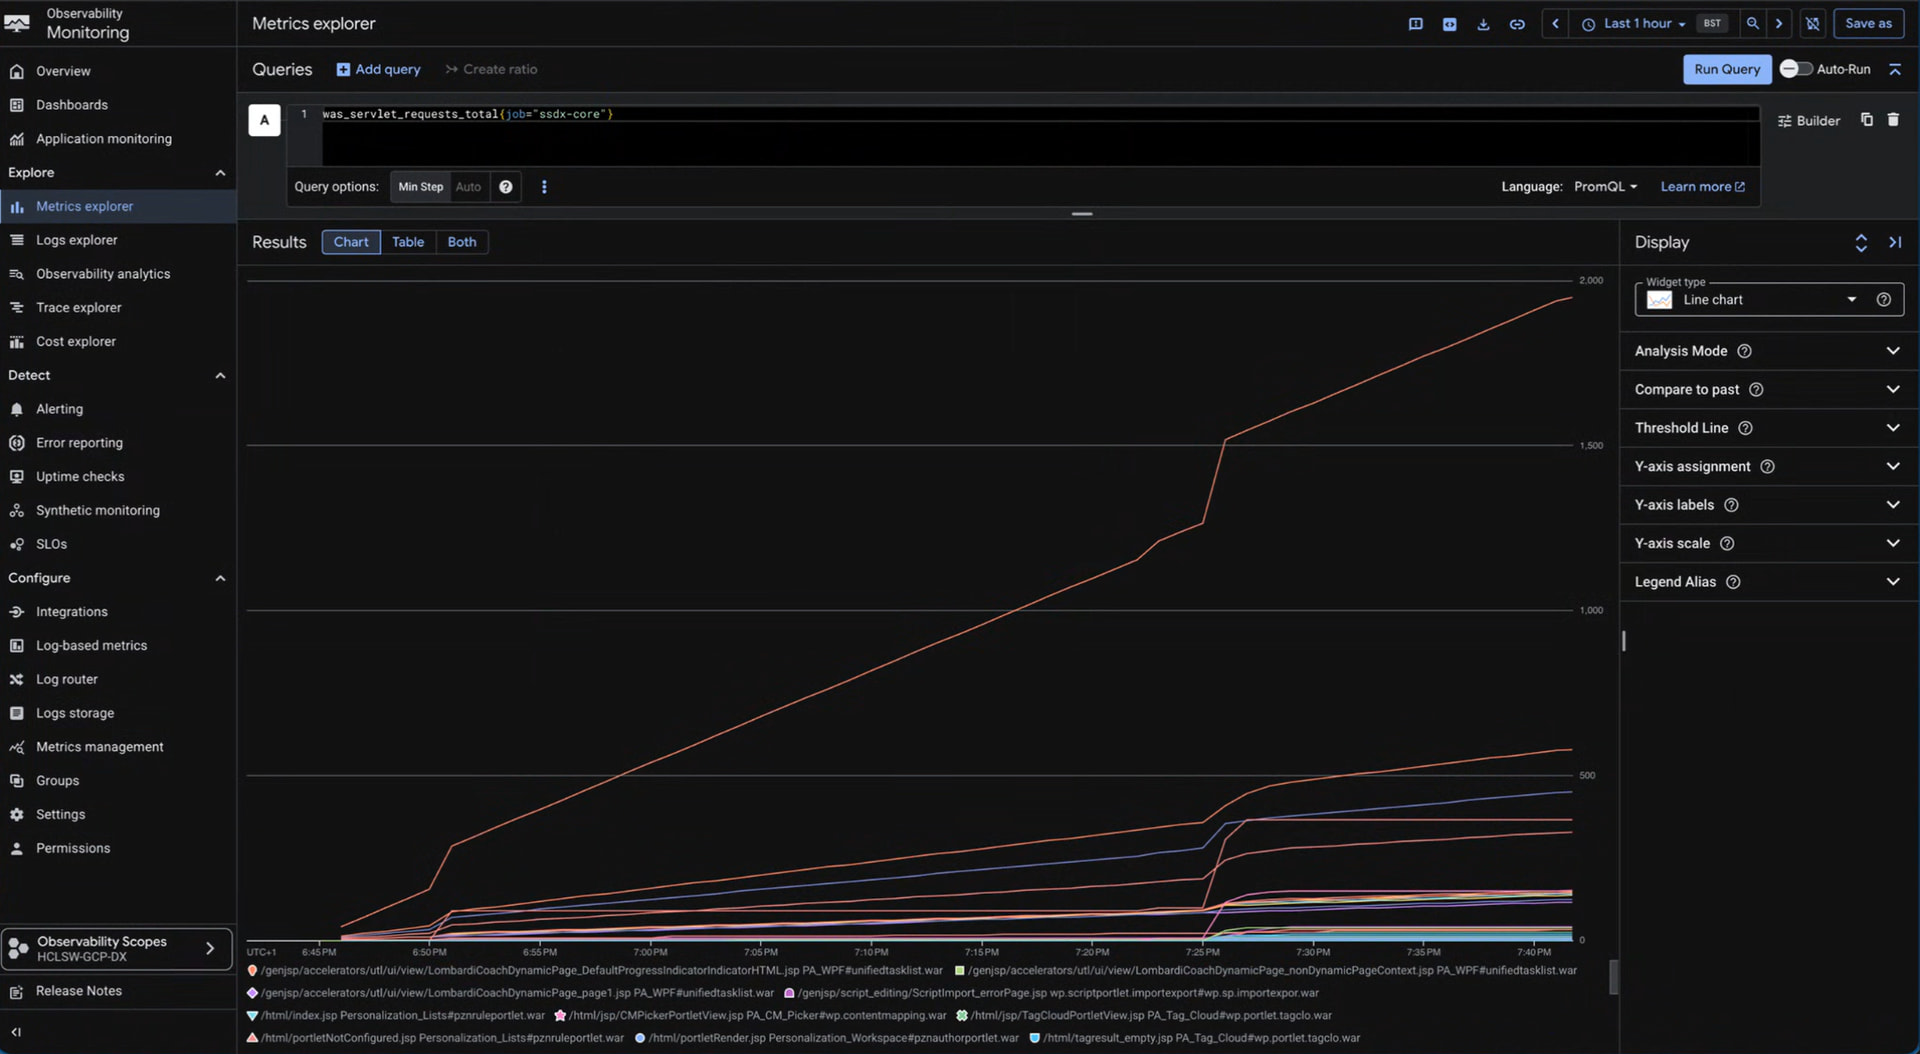
Once ingestion is working, open the Google Cloud Console, navigate to Monitoring, and open the Metrics Explorer.
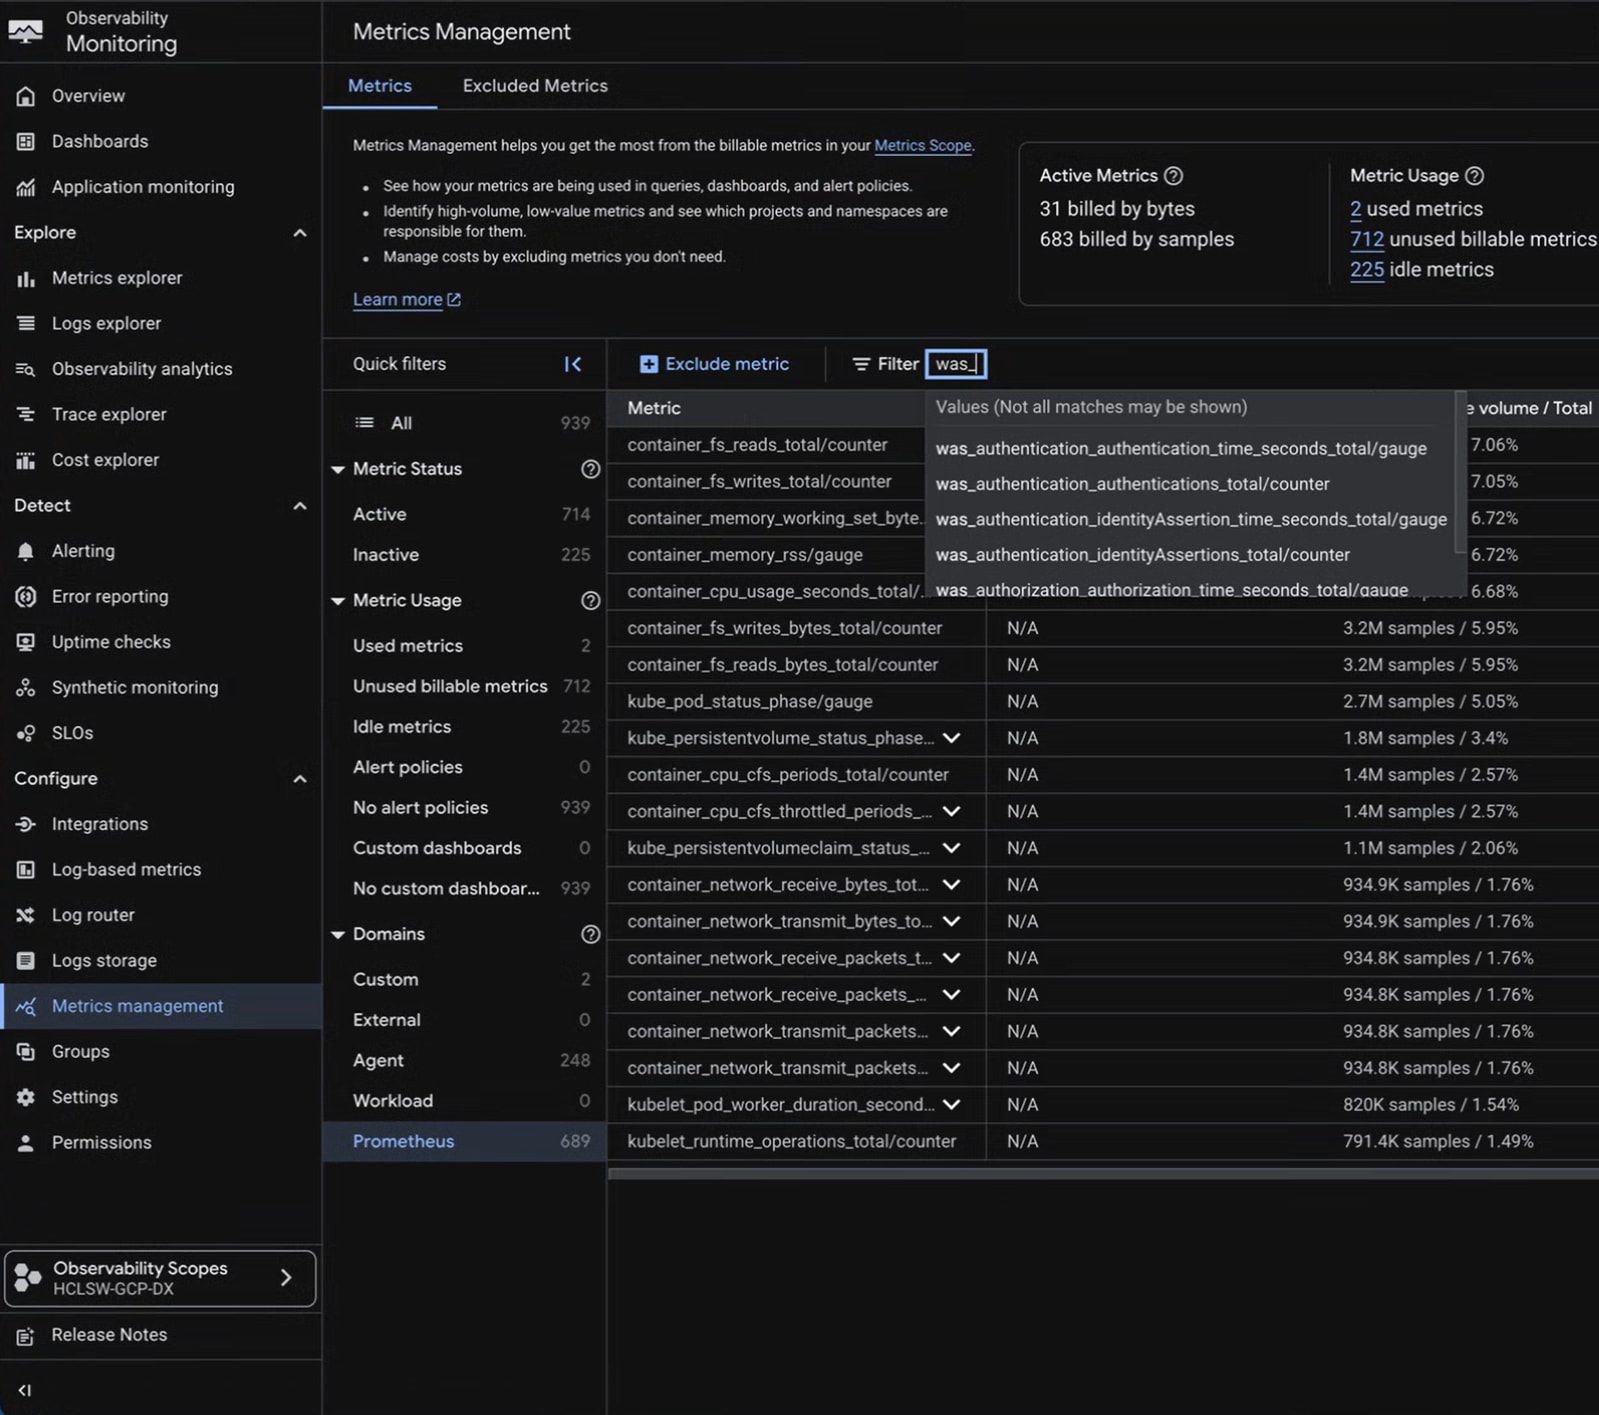
Interesting DX Application Metrics to Monitor
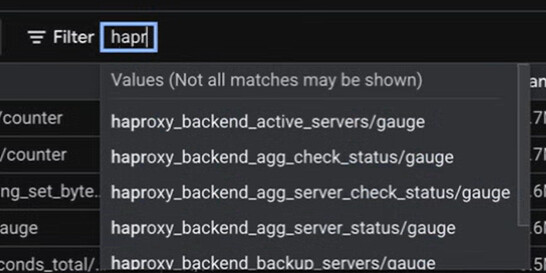
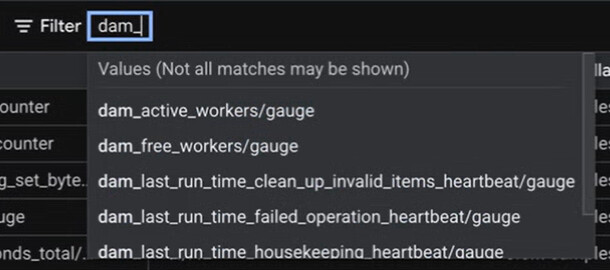
While checking basic endpoint reachability is a good first step, the real operational value comes from monitoring application-level metrics. For instance, you can filter for metrics starting with was_, haproxy_, or dam_ to gain deep insights into the DX platform’s internal state.
Here is a snippet of what the raw /metrics output looks like when hitting the Core endpoint directly:
# HELP was_threadpool_active_threads_count The number of active threads in the pool.
# TYPE was_threadpool_active_threads_count gauge
was_threadpool_active_threads_count{name="WebContainer"} 24.0

# HELP was_datasource_waiting_thread_count The number of threads waiting for a connection.
# TYPE was_datasource_waiting_thread_count gauge
was_datasource_waiting_thread_count{name="jdbc/wpdbds"} 0.0

# HELP was_session_live_sessions The number of live sessions.
# TYPE was_session_live_sessions gauge
was_session_live_sessions{name="default_host"} 145.0
Suggested Alerting Strategies
Instead of relying solely on basic availability and CPU/memory checks, consider setting up clear, actionable alerts based on the following leading indicators of system stress:
- WebContainer Thread Pool Saturation:
-
Metric:
was_threadpool_active_threads_count{name="WebContainer", job="mydx-core"} -
Why it matters: The WebContainer thread pool processes all incoming HTTP traffic. If the active thread count hits the maximum configured pool size, your DX server has effectively run out of processing capacity. It will begin queuing or dropping incoming user requests, leading to severe perceived latency or complete localized outages for users.
- Database Connection Starvation:
-
Metric:
was_datasource_waiting_thread_count{job="mydx-core"} -
Why it matters: Any value consistently greater than 0 indicates that application threads are actively blocked, waiting to obtain a database connection from the pool. This usually points to a severe backend database bottleneck, unoptimized slow SQL queries locking resources, or a connection pool limit that is simply configured too low for your traffic. This condition can quickly lead to cascading failures across the entire DX environment.
- Live User Sessions:
-
Metric:
was_session_live_sessions{job="mydx-core"} -
Why it matters: Tracking live sessions establishes a baseline for normal business hours. Sudden, unexplained drops to zero might indicate a load balancer configuration error or traffic routing issue preventing users from reaching the server. Conversely, anomalous, massive spikes could indicate a bot attack, a caching failure, or an architectural issue generating excessive unique sessions and threatening memory limits.
- HAproxy Backend Sessions:
-
Metric:
haproxy_backend_current_sessions{job="mydx-haproxy"} -
Why it matters: Tracking backend sessions can also help identify anomalous traffic.
Troubleshooting
1. Verify Configuration Acceptance
Check that the PodMonitoring resource was successfully processed by the GMP operator rather than being rejected for syntax errors:
kubectl -n mydx-ns describe podmonitoring mydx-core
Look for ConfigurationCreateSuccess and Status: True in the output. This confirms the YAML is valid, the CRD exists, and the collector operator has actively applied your configuration.
2. Verify Selector Matching
A common mistake is a mismatch between the PodMonitoring manifest and the actual workload labels. Ensure your labels are actively targeting the running pods:
kubectl -n mydx-ns get pods -l app=mydx-core
If this command returns no pods, your label selectors in the YAML do not match your Helm deployment, and the collector will silently scrape nothing.
3. Diagnose Scrape Failures
If you can query metrics in Cloud Monitoring but the target appears as failing or missing, it means the target was successfully discovered by the selector, but the actual HTTP scrape attempt failed. This is typically caused by connection refusals, routing to the wrong port/path, or the application failing to return properly formatted Prometheus payloads.
To diagnose this, bypass the collector and ensure the pod is actually emitting metrics by testing the endpoint directly from inside the cluster:
kubectl -n mydx-ns port-forward mydx-core-0 10038:10038
curl http://localhost:10038/metrics
If this curl command times out or returns an HTML error page, you have identified an issue within the pod itself, not the GMP setup.
4. Check Collector Logs (Advanced)
If you suspect an ingestion issue or an authentication failure on Google’s side, you can directly inspect the GMP collector daemon logs to look for errors, timeouts, or dropped payloads:
kubectl logs -l app.kubernetes.io/name=collector -n gmp-system --tail=200