This informational post serves to provide a procedure for debugging an Android app using the Android Debug Bridge (ADB) tool and serves as a complement to the Volt Iris documentation here:
https://opensource.hcltechsw.com/volt-mx-docs/95/docs/documentation/Iris/iris_user_guide/Content/SUG_Android.html#list-devices-and-view-logs
The ADB tool is a command line tool (Windows Command Prompt / MacOS Terminal) provided with the Android SDK. It is typically located in the [Android SDK Home]/platform-tools/ folder as a file named adb.exe (Windows) or adb (MacOS). It is useful for seeing device/emulator messages in addition to seeing any statements generated using the voltmx.print() API.
Prerequisites:
1. Android Studio + SDK installed (Windows or MacOS)
2. USB debugging enabled on device or Android emulator
3. Android device connected via USB or Android emulator started on local machine
4. Volt Iris project with application targeted for an Android device (phone/tablet). Have a package name entered under Project Settings -> Native -> Android Mobile/Tablet -> General Settings -> Package Name
Steps:
1. Build the application in Debug mode, run it on the device or emulator.
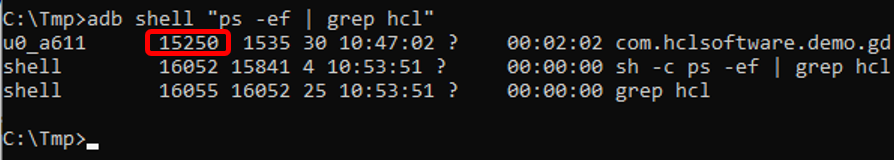
2. Open a command prompt or terminal and run the following command to find the process ID for the application. If the path to the tool is not in the user's path or shell environment the user will need to change to the SDK folder location prior to use. This command will return a list of processes with the package name string in it.
[Windows]
adb shell "ps -ef | grep [part of package name]"
[MacOS]
./adb shell "ps -ef | grep [part of package name]"
For example, if your package name is com.mycompany.category.myappname, entering in "myappname" is typically enough to identify the process. The first number value of the process in the list is the Process ID. You will need this for the next step.
Here's an example:
3. With the command prompt still up, you can focus and view all log messages generated by the application using the command below. Run the command and then click Start or Cancel in the Debugger prompt on the device/emulator. Chrome Dev Tools are not needed for this exercise but can be used in addition to streaming the log.
[Windows]
adb logcat --pid [PID identified above]
[MacOS]
./adb logcat --pid [PID identified above]
This will start to stream all log data from the application process. NOTE: This may be a lot of information. It will include all voltmx.print() output in addition to Android OS messages associated with the application. It will stream continuously until the user hits Ctrl+C / Command-C to exit or closes the terminal window.
![]()
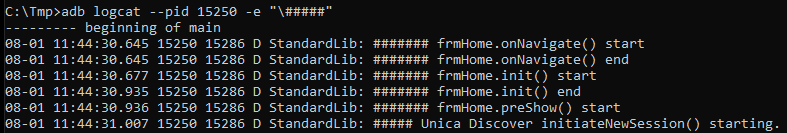
If the user wishes to apply a filter to view a subset of the statements, the -e option combined with a ECMA compliant regular expression may be used. One suggestion is to include a specific set of header or lead characters to identify voltmx.print() statements. For example, if the developer uses "#####" to start the log message string in all voltmx.print() statements, they can filter on the expression to only see those:
[Windows]
adb logcat --pid [PID] -e "\#####"
[MacOS]
./adb logcat --pid [PID] -e "\#####"
This makes locating user statements a quicker process and can be used to complement inline debugging with Chrome Dev Tools.
Optionally, the user may output the log contents to a file using standard Windows/Mac shell commands:![]()
Reference link to Android ADB:
https://developer.android.com/tools/adb