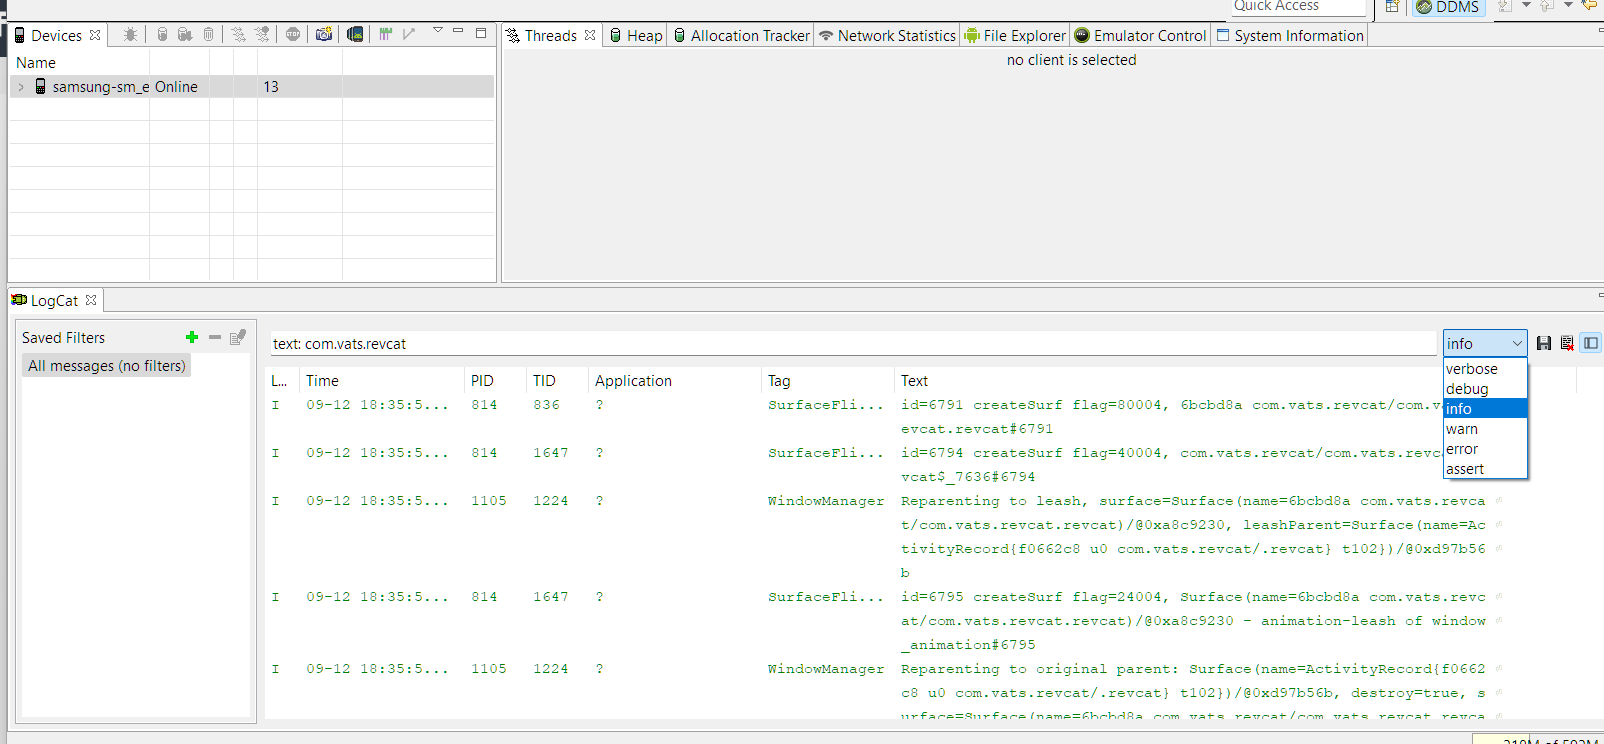
Thanks for your reply. By the way, I don't think that copying the entire logcat file and searching the same is a good thing, because the emulator just provides the best and easiest way to do so by filtering out the logs. Whatever is seen after running the command adb logcat is coming from the emulator itself.
Even in the snippet that you provided, it mentions that this information comes under the debug filter (denoted by the type D).
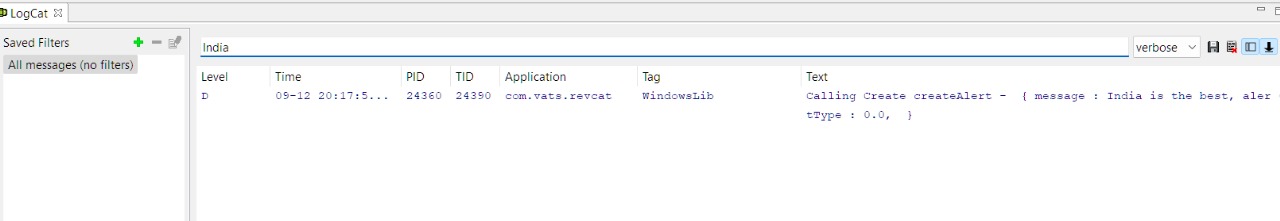
The logs are coming for the alert box that is being created in the application, but there is no trace of the voltmx.print thing.
You know, while doing this, what I found. We do not need this external platform tool & emulator to see the logs. Just the Chrome debugging session is enough and is way more useful and powerful. Here are the steps that I followed:
1. Create the debug-apk of the project
2. Transfer it to the testing Android device, and enable the USB-debugging option on that device.
3. Start the debugging session from the IRIS app (Debug -> Debug Native App -> Android Devices/Simulators), which gives me a Chrome debug session URL (have the port also appended)
4. Open the app on the device and click on start the debug session (make sure that the port number is the same as that of the chrome debug session)
5. You can refresh the Chrome debug session so that the device and the Volt Iris app can sync together.
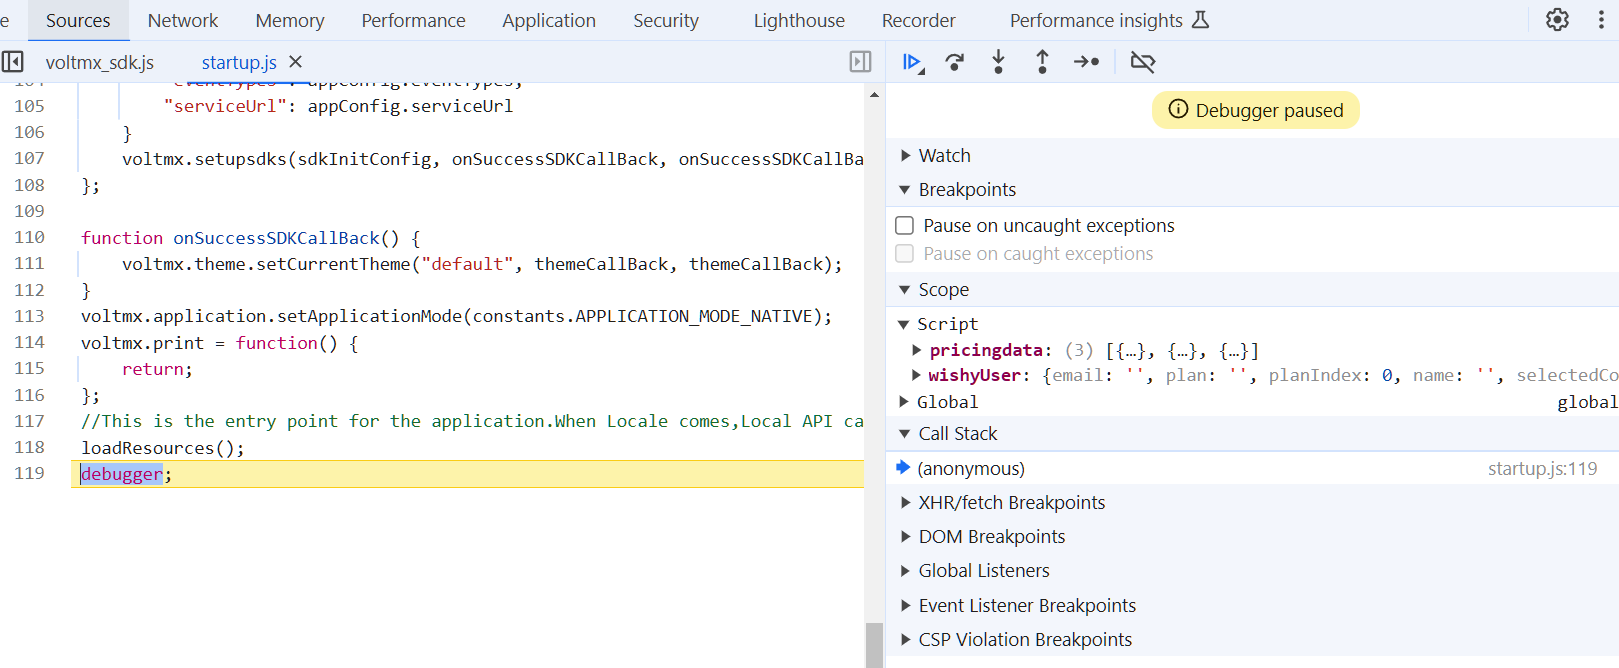
6. Once the debug session is active, you will see on the app screen that nothing loads up. That is because the debugger session pauses the execution of the app in the startup.js file. Click on the resume button (which is at the bottom of the RECORDER text)
That will load up the application on the device.
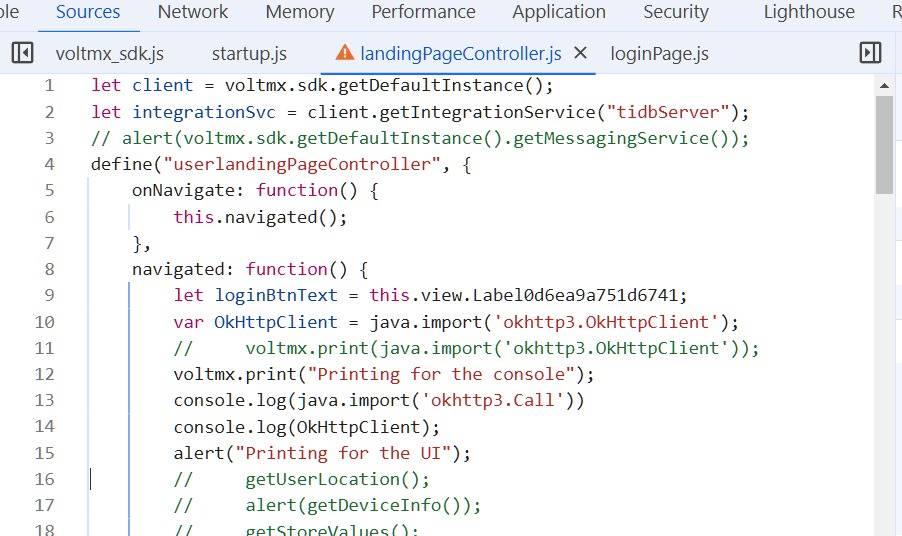
7. After that, your all of the controller js files will be shown in the debugger. You can go inside any of the files, and add a console.log statement wherever needed. For instance, I added this statement in the landingPageController
Save it, by pressing Ctrl+S. Once you do that, you can see a warning dagger which shows that this file is changed in the console, and the actual app code differs.
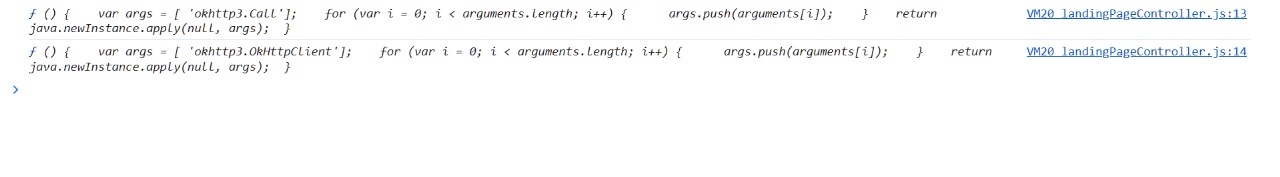
Now, whenever this file is run again, you will see the console statement in the console section
So, in this way you can just use chrome debugger to efficiently see the logs (because if some external libraries are used in the code, then the debugger session in the preview mode doesn't work)
I hope that this will help someone trying to use debugging for an app 🫡