Hello
When you shutdown Sametime 12 (Docker) or completely restart the operating system, the Grafana statistics settings are removed. How do I configure persistent storage to preserve Grafana settings?
Thanks
Al.
Hello
When you shutdown Sametime 12 (Docker) or completely restart the operating system, the Grafana statistics settings are removed. How do I configure persistent storage to preserve Grafana settings?
Thanks
Al.
Hi Ales -
Hi Tony,
thanks. I suggest to add a simple setting for "non-Admins" Grafana to the Sametime documentation. Or have an option to create this setting automatically during installation.
AL.
Hello Ales,
i had the same problem and I would prefer if hcl could give a short documentation on this. Reading other documentation w/o knowledge of the product could take a while.
Here are my infos.
1. First you create a volume for Grafana storage
> docker volume create grafana-storage
2. with the following parameter you can check the storage path
> docker volume inspect grafana-storage
Should be something like this
{
"CreatedAt": "2023-02-03T15:59:52+01:00",
"Driver": "local",
"Labels": {},
"Mountpoint": "/var/lib/docker/volumes/grafana-storage/_data",
"Name": "grafana-storage",
"Options": {},
"Scope": "local"
}
]
3. Edit your docker-compose-monitoring.yml file to map the persistent volume
> add the red values
grafana:
image: grafana/grafana
user: root
depends_on:
- prometheus
ports:
- 3001:3000
volumes:
- grafana-storage:/var/lib/grafana
- ./grafana/provisioning/:/etc/grafana/provisioning/
env_file:
........
volumes:
grafana-storage:
external: true
networks:
sametime.test:
4. Maybe you want to add additional users for using the sametime dashboard (not using the grafana admin account)
https://grafana.com/tutorials/create-users-and-teams/
Hope this helps
Alex
Hi , i have created the volumes and added as external in yml file but now prometheus container refuse to start.
please help
Did you create the volume via "docker volume" command with the same user you are running docker-compose ?
I use this with root access
Check the rights to the the grafana volume
/var/lib/docker/volumes/grafana-storage/_data/
Please also check if you entered the yml parameter correctly; never use TAB - yml configuration needs 2 spaces for each section (see e.g. the spaces via dots)
volumes:
..grafana-storage:
....external: true
You can validate the yml file with the following command
docker-compose -f docker-compose-monitoring.yml config
If there is an error youre output will show you the wrong line
Hi , yes i have done the volumes under root user
please find attached the monitoring.yml renamed to monit.txt , if you can have a look at it because i'm not a guru of docker
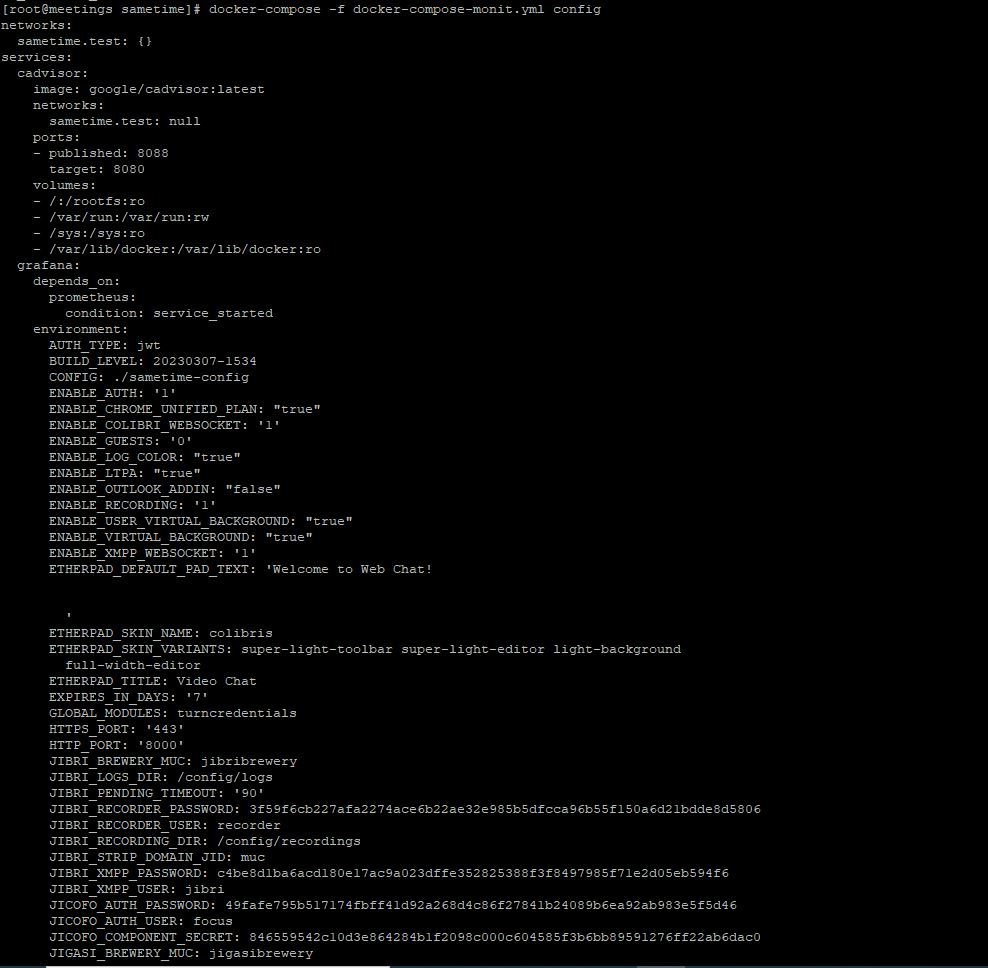
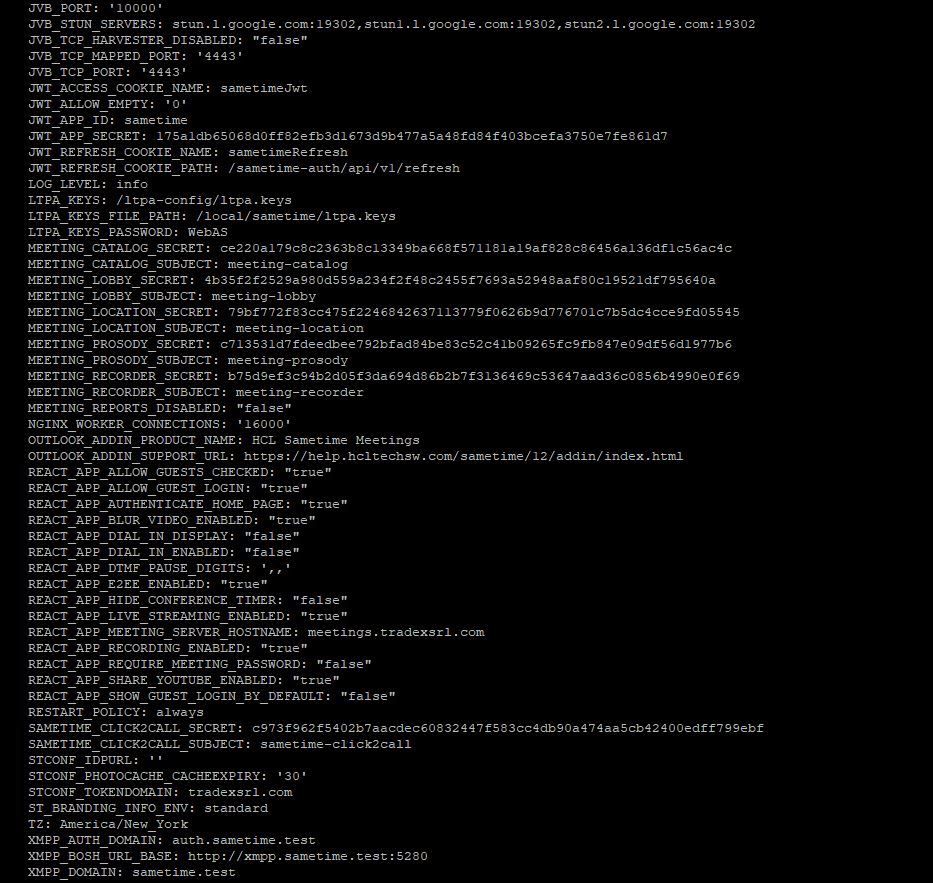
i have run the docker-compose against this file and it gives me this output , so i don't understand if there are errors:
docker-compose-monit.txtHello @Marco Zaro
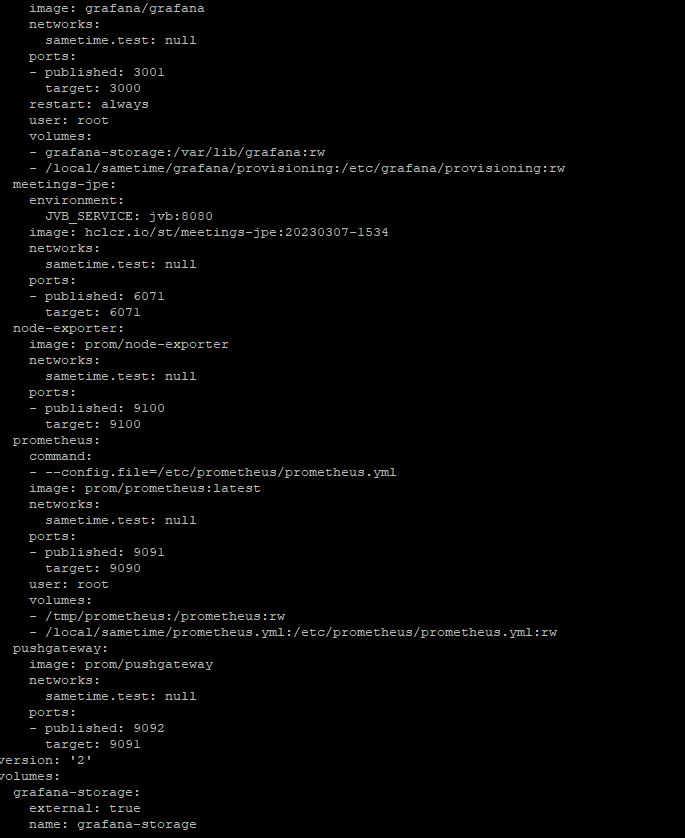
i checked your yaml file and as i explained you did not formatted the file correctly.
The best way would be to use a editor you can better control yaml files > e.g. visual studio code
"The recommended way to indent YAML files is to use two spaces per level of indentation, as tabs can cause parsing errors."
Your yaml file (dots are representing spaces)
..volumes:
...grafana-storage: < you have a missing space here (should be 4 spaces, not 3)
....external: true < you have a missing space here (should be 6 spaces, not 4)
correct syntax
..volumes:
....grafana-storage:
......external: true
Thats why the the grafana container will not load.
thank you , i solved using notepad++ , now the data is retained after server restart.