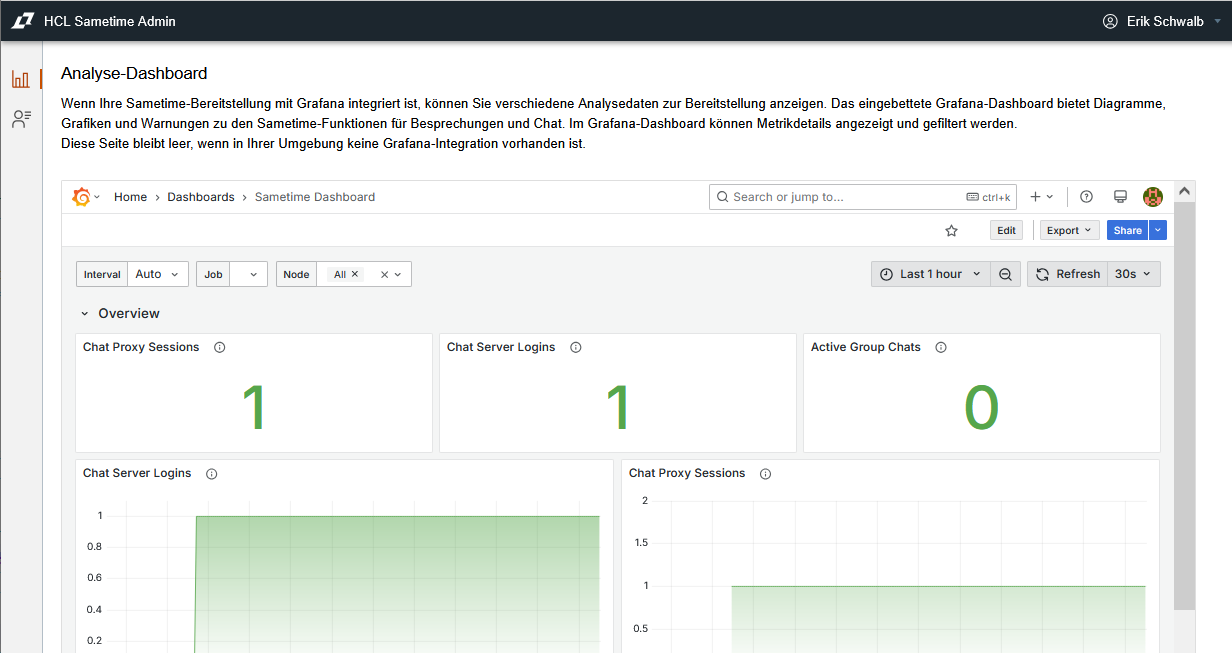
I have configured the Monitoring Dashboard for Sametime 12.0.2 FP2 on Windows and decided, that i wanted to run both Prometheus and Grafana on the same Windows host where Sametime is running.
Here are some tips:
- Download the latest Prometheus 2.53.x LTS release https://prometheus.io/download/
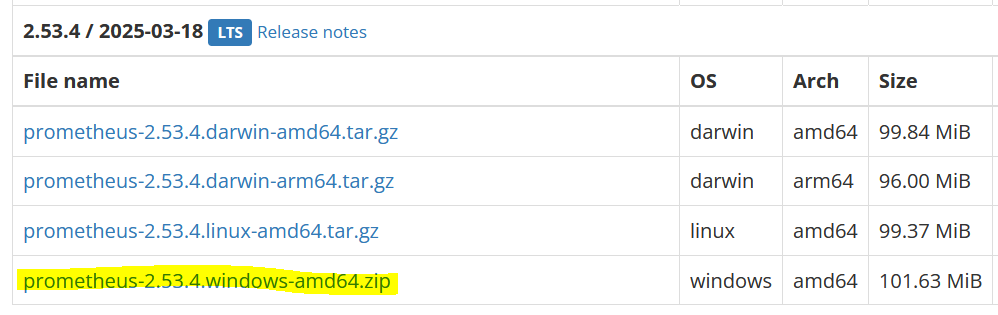
fyi - I could not get the dashboard to work with the latest Prometheus 3.2.1 release.
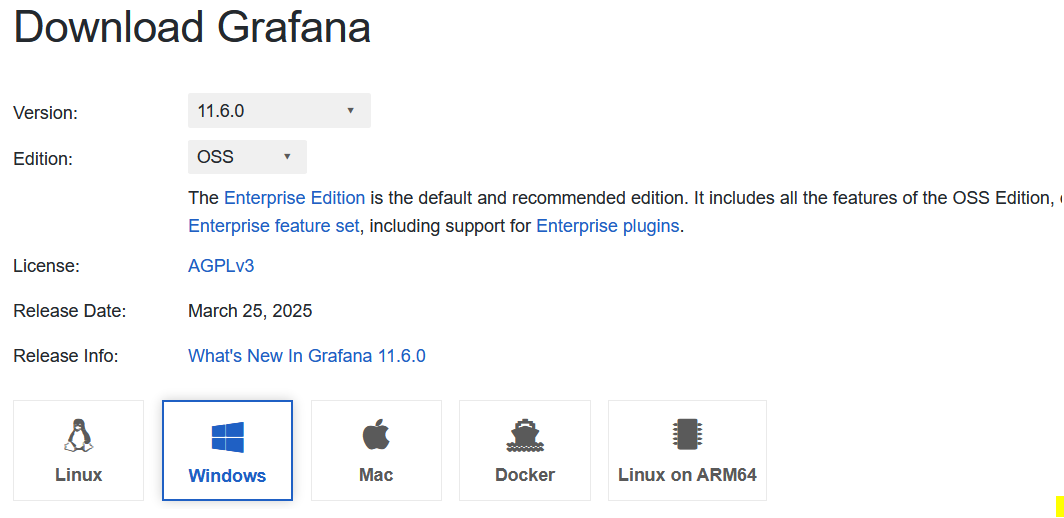
- For Grafana i downloaded the 11.6.0 OSS version.
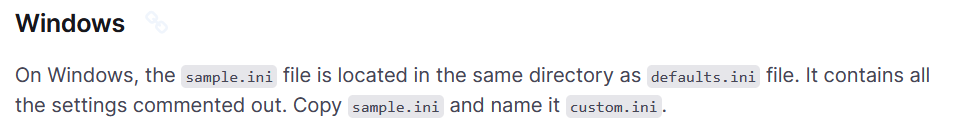
The official Grafana documentation suggests, that you should never edit the file defaults.ini. Instead create a copy of sample.ini and rename that copy to custom.ini. Then configure the required settings from the Sametime documentation in custom.ini.
https://grafana.com/docs/grafana/latest/setup-grafana/configure-grafana/
- Once all Sametime services are running, start Prometheus followed by Grafana. You should then be able to see the dashboard embedded in the Sametime Admin Web UI.